Who is Educating Students with Disabilities, and How Are They Doing?
In New Orleans public schools, students with special needs now represent 9.1% of the overall student population. If every school enrolled a proportionate share, students with disabilities would represent 9.1% of each school’s student body. But that is not the case.
Recovery School District (RSD) schools are serving a much larger share of special needs students than are OPSB schools.
| District | % of Student Population |
| RSD (direct-run and charter) | 10.2% |
| OPSB (direct-run and charter) | 6.7% |
RSD charters exceed the city average in their percentage of students with disabilities.
| District | % of Student Population |
| RSD Charters | 9.4% |
| City Average | 9.1% |
Critics of the RSD and of charter schools have repeatedly pointed to special education as a glaring problem – alleging charter schools are not accepting students with disabilities. It is time to put this argument to rest. With the 2/1/11 student count information now available, it is clear RSD charter schools are serving students with disabilities.
View enrollment of students with disabilities by school (number and %).
Student Achievement: How are special education students performing?
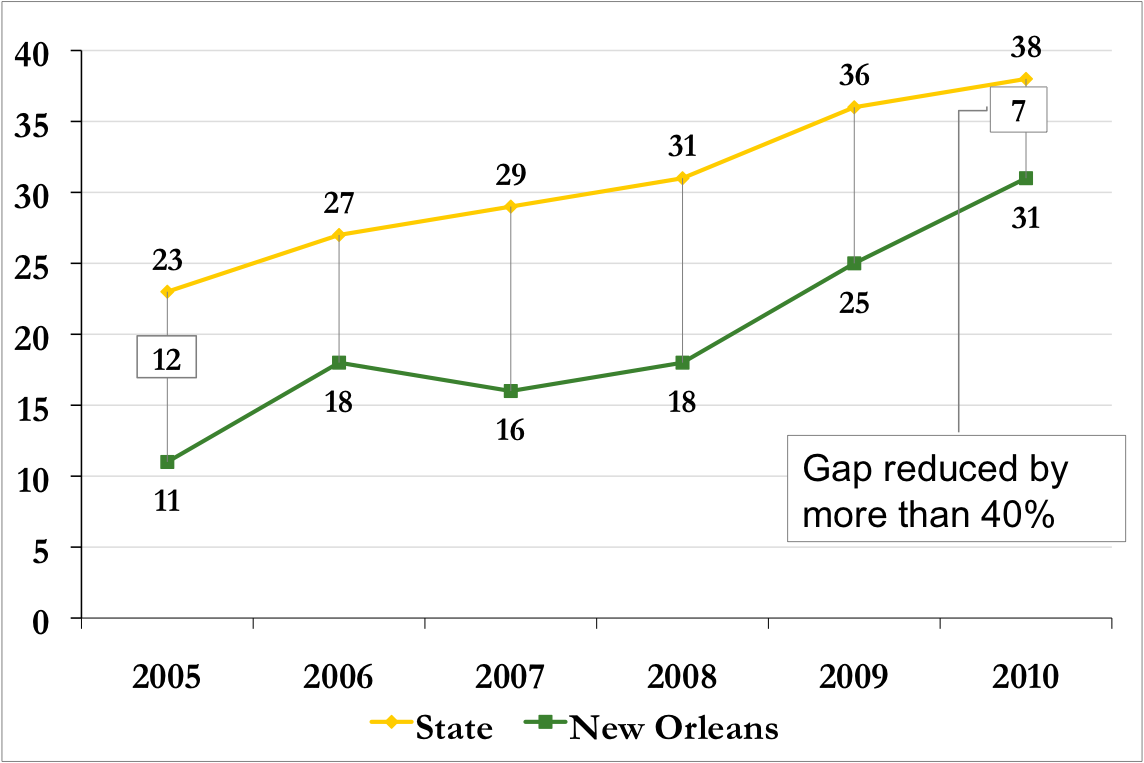
So how well are schools doing in serving their special education students? Better than before, but still a long way to go. In 2004-2005, only 11% of special education students in New Orleans were grade-level proficient. In 2009-2010, that percentage had nearly tripled to 31%.
As in other areas of academic achievement, New Orleans is improving at a much faster rate than the rest of the state. The margin between special education students in New Orleans and special education students statewide has narrowed from 12 points in 2005 to 7 points in 2010.
Special Education Student Performance
% Basic or Above
Shout Out: High performing schools serving higher percentages of special needs students
The schools below all serve more than the city average of 9.1% students with disabilities and have a School Performance Label of 2 stars (SPS > 80) or higher.
| District | School Name | % SWD | 09-10 SPS |
| OPSB Direct Run | Mary Bethune Elementary Literature/Technology | 19.1% | 123.7 |
| OPSB Direct Run | Benjamin Franklin Elem. Math and Science | 13.4% | 114.4 |
| OPSB Charter | Alice Harte Elementary Charter School | 9.5% | 94.4 |
| RSD Charter | New Orleans Charter Math and Science Academy | 14.8% | 89.2 |
| RSD Charter | McDonogh 15 School for the Creative Arts | 10.2% | 87.7 |
| RSD Charter | Arthur Ashe Charter School | 28.0% | 83.8 |
Conclusions
- The issue is no longer whether or not charter schools are enrolling students with disabilities. They are.
- That said, there are still some charter schools that are way below the city average in the percentage of special needs students they serve. Their charter authorizers (OPSB and BESE) need to make certain these schools are not wrongly excluding special education students.

